15/11/2022
Asset allocation in inflationary times
Newsletter #54 - November 2022
At least for now, the optimistic notion of inflation being only transitory appears to have been consigned to history. On 11 November, The EU Commission published its Autumn 2022 Economic forecast, together with a press release stating “inflation yet to peak before gradually easing”.
The EU Commission forecasts that economic growth will contract to a growth rate of 0.3% in 2023, with economic recession very possible in Q4 2022 and Q1 2023. Despite the lower growth rate, the Commission also predicts that EU employment will remain around all-time highs, with unemployment rates only increasing slightly in 2023 and 2024.
The Commission also expects a regional inflation rate of 7% for 2023, before declining to 3.4% in 2024.
Figure 1 EU HICP annual inflation rate with EU Commission Autumn 2022 Forecast
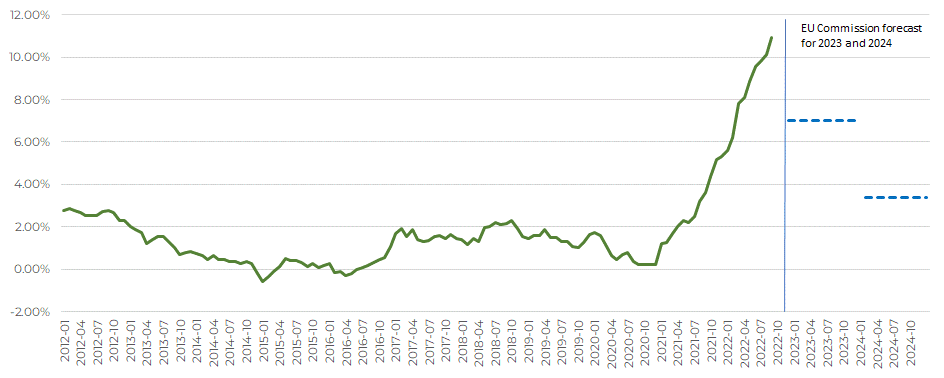
With inflation yet to peak according to the Commission, this seems a rather optimistic forecast, given the fact that growth is expected to remain positive in 2023, and, with EU employment at an all-time high; the base effect on the HICP index can only help so much in bringing down inflation.
Nothing indicates that the ECB will be inclined to stop hiking interest rates in the near future, and any talk of lowering interest rates seems premature.
Retroactive allocation performance since March 2017
Although considering what-if or what-could-have-been scenarios will never improve historical performance, it is nevertheless important to identify the characteristics of different asset allocations.
Figure 2, below, compares two different asset allocations from March 2017 up to and including October 2022 and illustrates the returns over the period
The “standard” allocation contains 50% equity (STOXX Europe 600 index) and 50% bonds (Bloomberg EUR Agg TR Index), while the “alternative “ allocation contains 40% equity / 40% bonds / 20% allocation to an alternative investment using the performance of Quantrom P2P Lending for the calculations.
Figure 2 50% Equity / 50% bonds performance vs. 40% / 40% / 20% Quantrom P2P Lending allocations
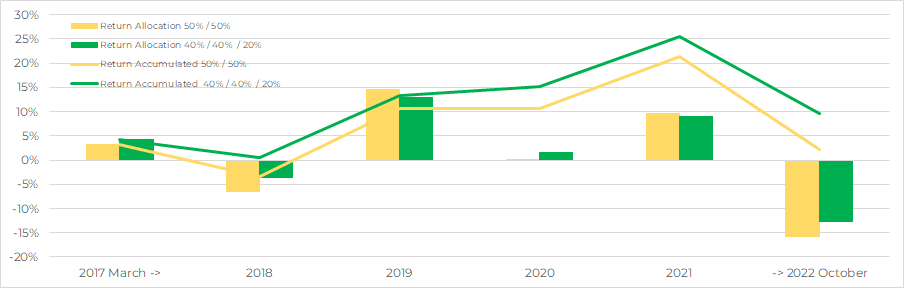
Entering a stable and cash-flow focused asset into the allocation does not lower the return in “good” years by much. However, a real difference arises in the “difficult” years, where losses are a lot smaller; and over time, this leads to better overall performance. In other words, an investor does not have to sacrifice much in order to limit downside risk.
Fresh return forecast from the Danish return council
In mid-October, the Danish Return Council (Afkastrådet) released a new forecast for the expected returns of different asset classes. These expectations are incorporated into calculations relevant for investors and pension plan holders in Denmark.
Table 1 Expected return from different assets
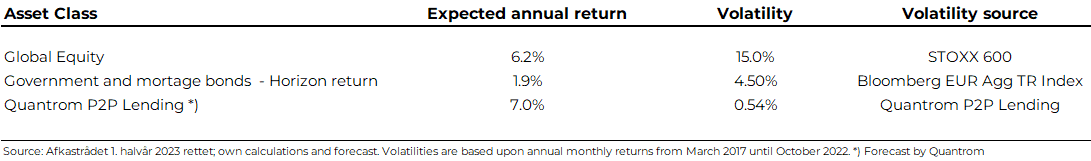
The Danish Return Council’s forecast will have difficulty in keeping up with inflation over the coming years (see Table 1 and Figure 1, above). Our expectation for the expected annual return of Quantrom P2P Lending is based on the last 5 years’ returns, a period in which all annual returns, with the exception of COVID-19 2020, have been above 7%.
Using these forecasts it is possible to construct our two simple portfolios: one with 50% equities and 50% bonds, and a second with 40% equities, 40% bonds and 20% Quantrom P2P Lending representing an alternative investment with strong underlying cash flow generation.
The result of these calculations is presented in Table 2, below.
Table 2 Expected portfolio returns with different asset allocations
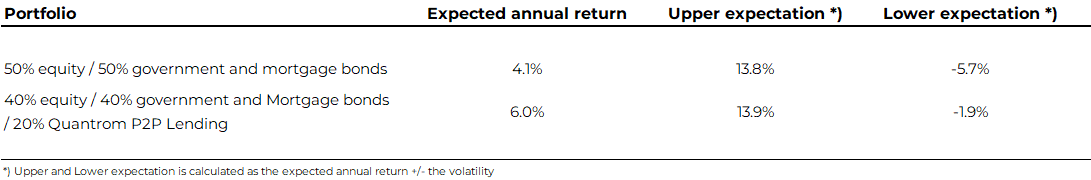
It is hardly surprising that the performance of the 40%/40%/20% portfolio offers a better expected return, given that QP2PL has a higher expected return.
The more interesting observation is that, even in the case of a very “positive” year in which returns reach their upper limits, the total return of the 40%/40%/20% portfolio of 13.9% is still slightly better than the 50%/50% portfolio of 13.8%.
In contrast, in a “negative” year approaching the lower limits there is a much larger difference. The 50%/50% portfolio would generate a loss of 5.7% against a loss of 1.9% in the 40%/40%/20% portfolio.
A reallocation towards a stable alternative investment would therefore generate a higher expected return, while simultaneously reducing the expected loss in a negative scenario by more than 3%-points without surrendering any upside – something surely worth considering for an investor.
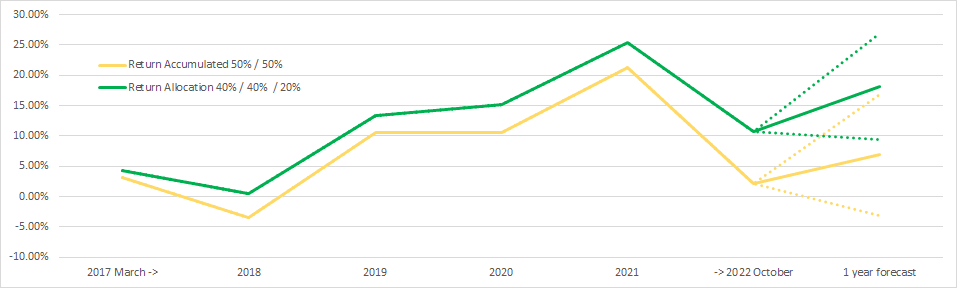
The outcome of the different scenarios is illustrated in Figure 3 below.
Figure 3 Historical portfolio returns with 1 year expected return with upper and lower expectations.