26/09/2025
GDP what it is for, and who pays for what?
Newsletter #84 - September 2025
What is GDP for?
When the media report on GDP, the focus is almost invariably reduced to absolute figures (billions of euros, dollars or kroner) without clarifying the underlying structure of what GDP actually represents.
At its most elementary level, GDP is not merely a number, but an equation, namely the total production of goods and services within an economy on the one side, and the aggregate of consumption, which necessarily balances with production by definition, on the other.
This deceptively simple identity can subsequently be elaborated into more intricate formulations that incorporate imports, exports, intertemporal adjustments and sectoral breakdowns. Yet, no matter how many variables are added, the fundamental principle remains unaltered: the macroeconomic accounts must reconcile.
Within any economy, choices are therefore unavoidable. Given a certain level of productive output, societies must decide how that output is to be allocated and consumed. This raises the central normative question: what purpose does GDP serve?
The size of the public sector, often framed ideologically as either virtuous or detrimental, is in fact a matter of collective choice rather than objective economic truth. Likewise, the uses of tax revenue reflect deliberate societal priorities.
In this edition of the newsletter, we turn our attention to Denmark, France, Germany and the US, examining how each political economy structures its taxation and allocates resources to finance public expenditure, according to the most recent statistics. The contrasts reveal not only different fiscal architectures, but also divergent conceptions of the role of the state in economic life.
The architecture of taxation
Denmark
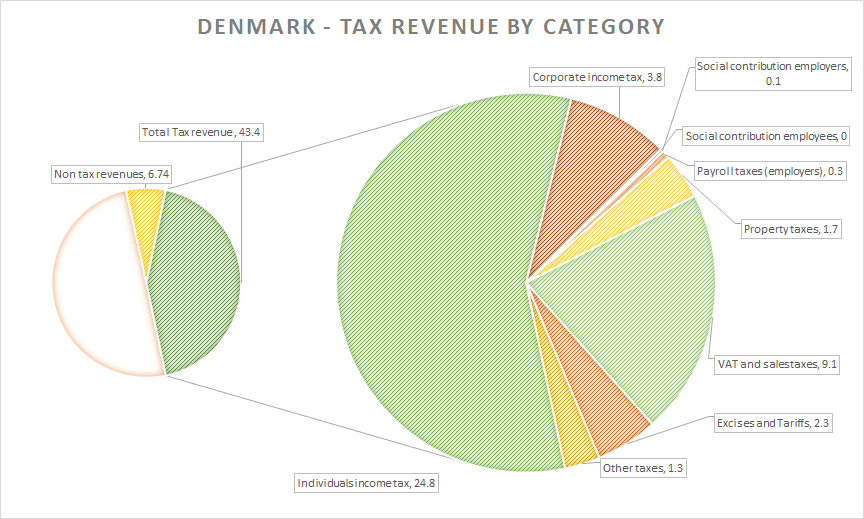
Denmark’s fiscal state is expansive yet distinctive. With tax revenues amounting to 43% of GDP, it stands among the highest in the OECD. What makes Denmark exceptional, however, is not only the level but the structure of taxation.
The most recent data, from 2023, show that personal income taxes alone contribute 25% of GDP, while consumption taxes, primarily VAT, add approximately 12%. Corporate income taxes represent less than 4%, and social contributions are almost negligible.
The Danish state thus finances itself not through heavy levies on employers, but through transparent taxation of earnings and consumption. This choice is intimately bound up with the country’s “flexicurity” model: by keeping payroll contributions low, employers retain flexibility to hire and adjust their workforce without facing crushing fiscal charges; at the same time, workers are protected by a generous welfare state, funded through broad taxation, which guarantees income security during periods of transition. The Danish tax system is therefore not only a fiscal device but a structural foundation for labour market dynamism.
Figure 1 Denmark tax revenue 2023 as percentage of GDP source OECD
France
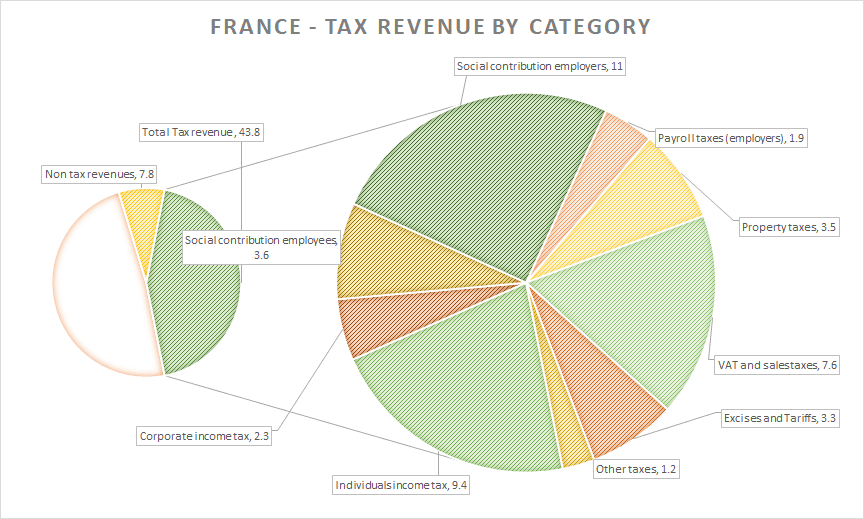
France, by contrast, raised revenues of a nearly identical 44% of GDP in 2023, but through a radically different configuration.
Social contributions dominated at around 17% of GDP in 2023, dwarfing the shares of personal income taxes (9%), consumption taxes (11%) and corporate taxation (2%).
Here, the welfare state is financed primarily through employer and employee contributions, which tie entitlements directly to employment. This design guarantees income continuity for workers but places a heavy burden on firms.
Unlike in Denmark, where the flexicurity model reduces labour costs and supports mobility, the French system embeds rigidity into the economy by making employment expensive and redundancies politically difficult.
Figure 2 France tax revenue 2023 as percentage of GDP source OECD
Germany
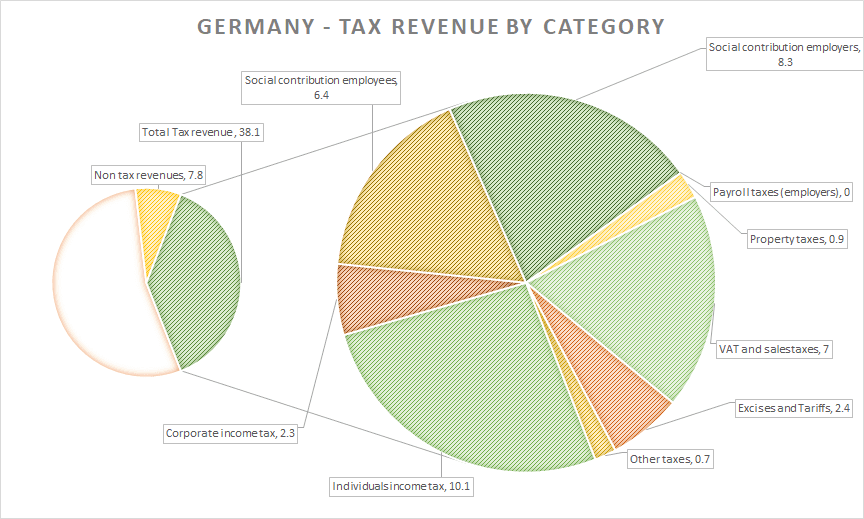
Germany collected 38% of GDP in tax revenue in 2023, with a structure again centred on social contributions (15% of GDP). Personal income taxation accounted for 10%, consumption taxes 9% and corporate taxation just over 2% of GDP.
This Bismarckian model, like the French one, ties social entitlements to employment. The reliance on payroll-based financing places significant obligations on firms and makes the system vulnerable to demographic shifts.
As in France, the German model is highly dependant on the shrinking contributions of an ageing workforce.
Figure 3 Germany tax revenue 2023 as percentage of GDP source OECD
United States
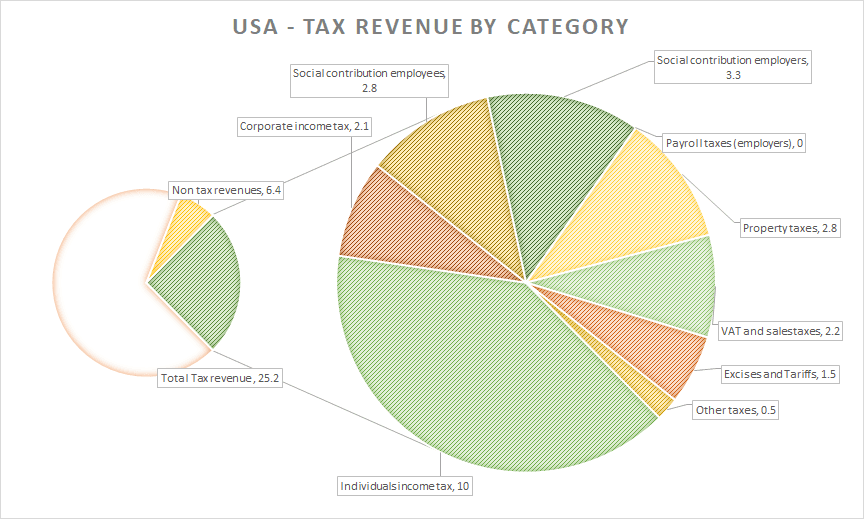
Lastly, the US stands apart from the others, with revenues of 25% of GDP in 2023. Personal income taxes accounted for 10%, social security contributions 6%, consumption taxes 4% and corporate taxation at just 2% of GDP. Property taxes amounted to slightly more than 2% of GDP.
The absence of VAT and the reliance on income taxation reflect a preference for less direct state involvement.
Unlike Denmark’s flexicurity system, the American model leaves healthcare, education and unemployment protection heavily in the domain of private households and markets.
Figure 4 USA tax revenue 2023 as percentage of GDP source OECD
The structure of expenditure
Denmark
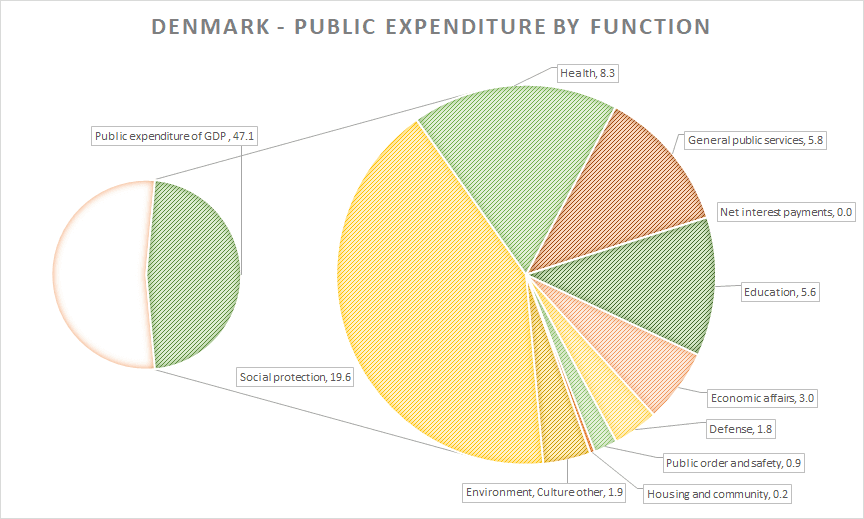
Denmark’s expenditures reached 47% of GDP in 2023, underscoring the ambition of its universal welfare model.
The allocation was broad: healthcare absorbed 8%, education almost 6%, and social protection (such as pensions, unemployment benefits etc.) close to 20% of GDP.
This distribution again reflects the central principle of flexicurity: public resources are invested in services and income support that make workers both secure and mobile.
Healthcare and education strengthen human capital, while pensions and unemployment insurance guarantee income continuity. Employers are thus freed from carrying these costs directly, making it easier for firms to adapt to economic change, while workers remain confident that transitions will not bring social ruin.
Figure 5 Denmark public expenditures 2023 as percentage of GDP source OECD
France
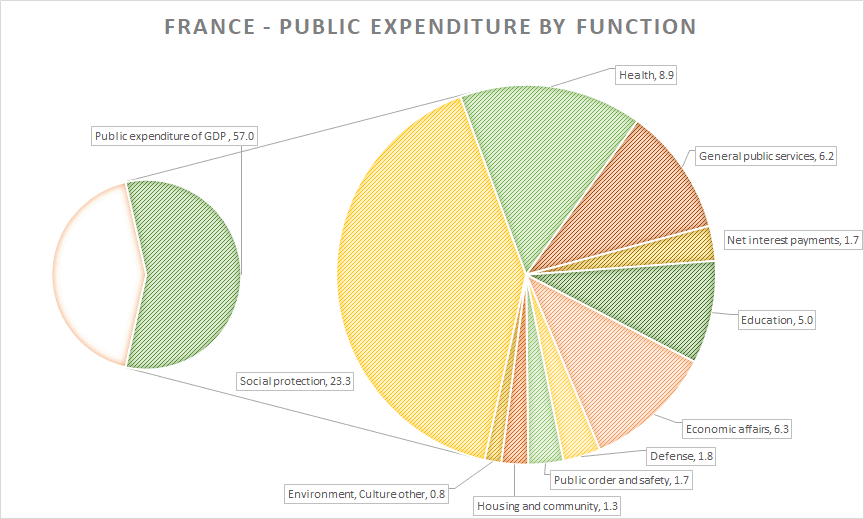
France, by contrast, devoted 57% of GDP to public spending in 2023, with social protection alone consuming more than 23%, healthcare 9% and education 5%.
This concentration on transfers highlights the contrast with Denmark. Whereas the Danish state invests heavily in universal services as part of its flexicurity commitment, France channels resources primarily into pensions and unemployment benefits financed by employer contributions.
The system thus protects insiders in the labour market but provides less emphasis on enabling mobility and adjustment. The result is a welfare state that is generous but also rigid, with fiscal burdens that weigh heavily on job creation.
With an ageing population and an outspoken public aversion to structural reforms in the pension and unemployment system, public finance is spinning out of control.
Figure 6 France public expenditures 2023 as percentage of GDP source OECD
Germany
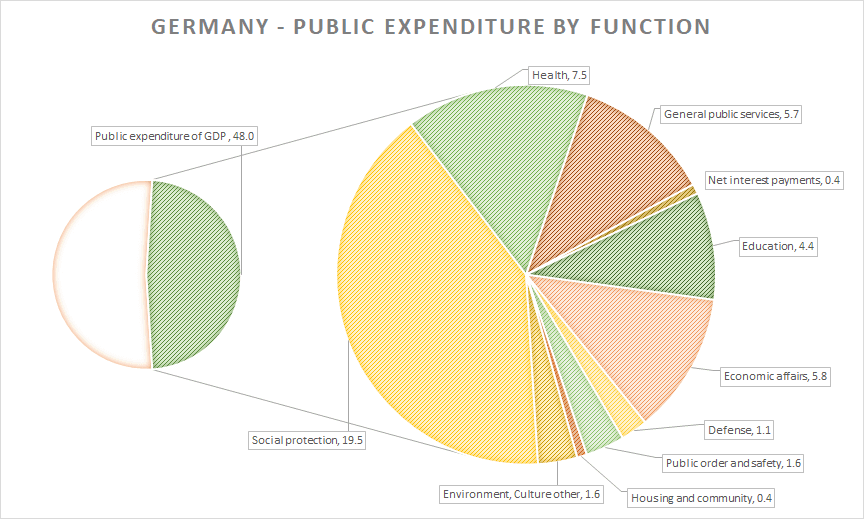
Germany’s expenditures were 48% of GDP in 2023, with social protection taking almost 20%, healthcare close to 8% and education 4%.
Like France, Germany channels the bulk of resources into contributory insurance schemes, reinforcing an employment-based model. The German system secures workers but risks locking them into existing structures.
Contrary to the Danish flexicurity model, the Germany puts an increased burden on employers, thereby reducing competitiveness.
Figure 7 Germany public expenditures 2023 as percentage of GDP source OECD
United States
US public spending was 39% of GDP in 2023, by far the leanest profile and completely different in comparison with European countries.
The chart shows social protection at only 8% of GDP, defence at 3% and education at more than 5%.
Healthcare, including Medicare and Medicaid, was almost 10% of GDP and net interest payments amounted to more than defence at 4%. Other elements were negligible.
The American state is thus narrow in scope, focusing on old-age programs and defence, while leaving education, family support and unemployment largely to private actors.
The American model provides targeted programs, but offers less collective security in the face of labour market risks.
Figure 8 USA public expenditures 2023 as percentage of GDP source OECD

Reflections
Taken together, these eight charts reveal divergent fiscal architectures.
Denmark raises and spends at very high levels but does so in a way that supports flexicurity: low payroll charges, high universal service and (as one of only a few countries in 2023) a budget surplus.
France and Germany rely heavily on payroll contributions and concentrate expenditures on pensions and social insurance; both run deficits, as can be deduced from the charts, with France’s gap particularly severe.
The US operates on a leaner scale. but also runs a large deficit, with Social Security, Medicare and defence weighing heavily on the federal budget.
The conclusion is clear: the structure of taxation and expenditure may differ (from universal in Denmark, contributory in France and Germany, to lean and market-oriented in the US), but the underlying arithmetic is inescapable.
When expenditure commitments outpace revenues, deficits mount. Denmark shows that balance is possible; France and the US illustrate that deficits at current levels are unsustainable; and Germany faces growing strain as demographics erode the contributory base.
Herein lies the fundamental problem: over the last 20-30 years, Denmark has been the only of the four to have undergone significant structural reforms.
Today, the pension age in Denmark is closing in on 70 years, while the official pension age in Germany will rise to 67 in 2031 and in France to maybe 64 for persons born after 1968.
However, the effective retirement age according to the OECD is estimated to be 2-2.5 years lower. This puts an enormous pressure on public finance, especially with an ageing population.
Without reforms to costs, French and German pension systems will be unsustainable.
The US has a different structural problem; while there is entitlement in healthcare and some pensions (the fundamental problem), politicians can only agree on spending more money and at the same time hand out tax reductions.
Without structural reform, all models converge on the same problem: fiscal imbalance.