19/11/2025
US CPI revisited
Newsletter #86 - November 2025
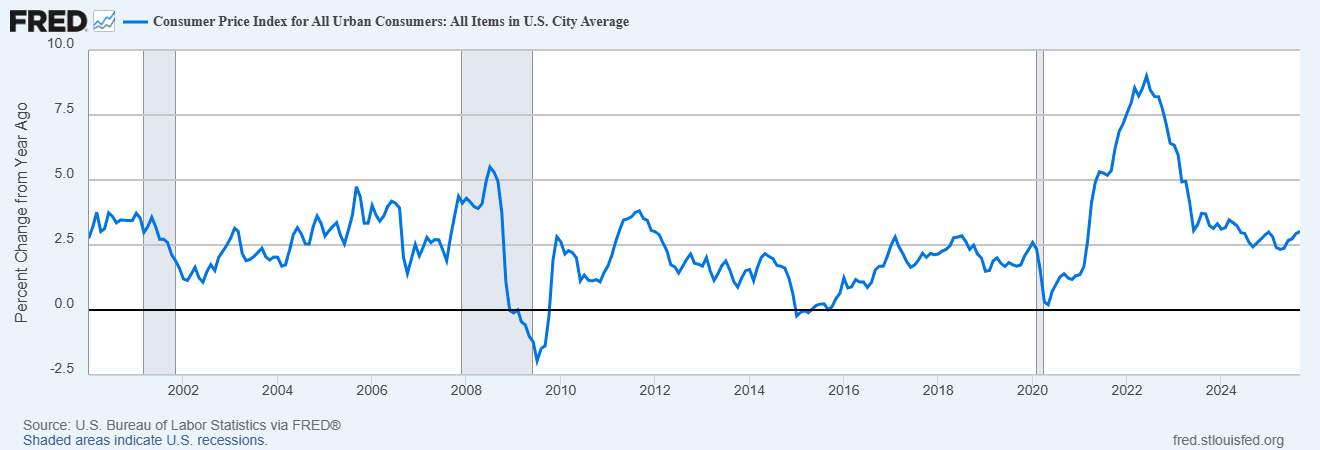
The prevailing expectation in financial markets is that the Federal Reserve will continue to ease policy as inflation moves lower. At a broad level, this view appears justified. As shown in Figure 1, overall US inflation has been trending downward, and the headline CPI has begun to flatten, indicating a loss of upward momentum. This development seemingly provides the FOMC with additional room to reduce interest rates.
Yet a more detailed inspection of the CPI structure reveals a more nuanced landscape. The moderation in the headline figure masks uneven development across key components.
Figure 1 US CPI index
Development in underlying CPI components
One of the central pillars of any CPI basket is the Food and Beverage category, which in the United States carries a substantial weight of 14.5% in the overall index.
Figure 2 US CPI - Food and beverage (weight 14.5%)
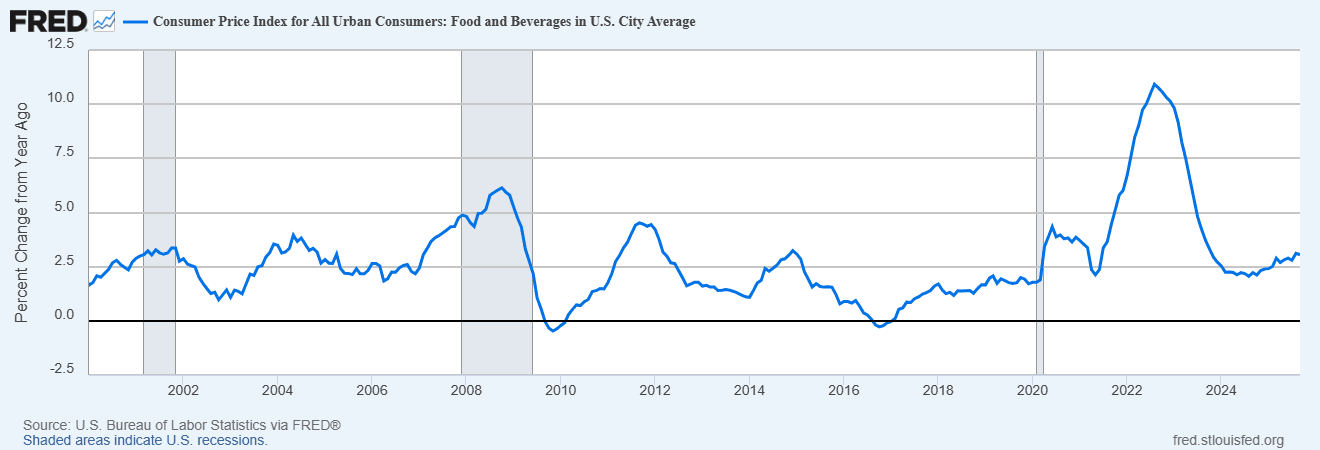
After bottoming out in the second half of 2024 at roughly 2% year-over-year, Food and Beverage inflation has re-accelerated. One year later, the rate has pushed back above 3%, signalling a renewed - and somewhat unexpected - uptick in price pressure within this key consumer segment. This reversal underscores that disinflation in staples is far from linear and remains vulnerable to supply-side shifts, weather-related volatility and ongoing cost pass-through in the food production chain.
Figure 3 US CPI - Durable goods (weight 10.9%)
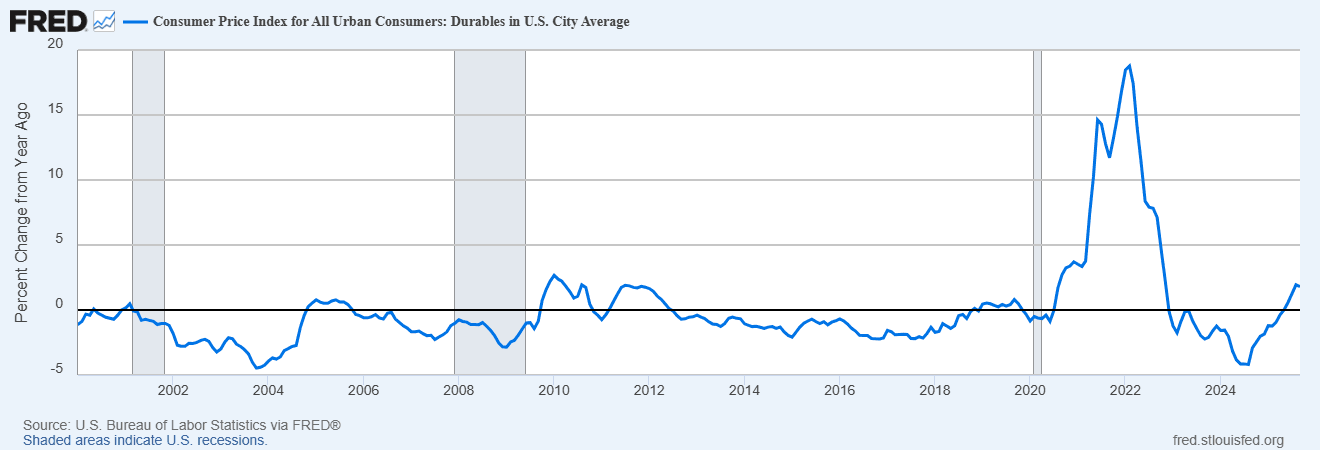
Durable goods, which represent 10.9% of the US CPI basket, have long served as a structural source of disinflation. Advances in technology and manufacturing efficiency have historically pushed prices lower, manifesting in faster computers, better appliances and more capable vehicles delivered at declining effective costs. As shown in Figure 3, this dynamic has shifted meaningfully. Durable goods are no longer exerting the steady downward pull-on inflation that characterized prior decades, signalling a material change in the behaviour of this category.
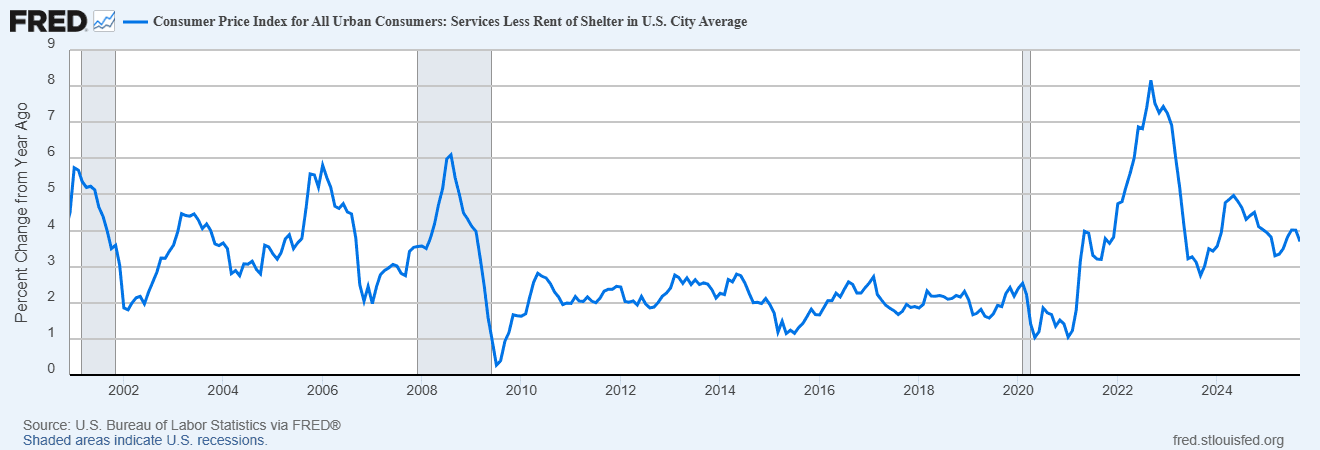
Services less shelter form one of the largest components of the index, carrying a weight of 28.8%, and this segment has proven notably resistant to disinflation. Since COVID-19, services inflation has dipped below 3% only once (in September 2023) and has since remained just under the 4% mark. Despite cooling in several goods-related categories, services less shelter continues to anchor inflation on the higher side, contributing significantly to overall price persistence in the U.S. economy.
Figure 4 US CPI - Services less rent of shelter (weight 28.8%)
Another component that consistently commands outsized attention is energy. Although it accounts for only 6.4% of the overall CPI basket, its inherent volatility ensures that it remains highly visible to the public and frequently dominates the inflation narrative. Policymakers often treat this category as noise, given its sensitivity to global commodity cycles and geopolitical shocks, but for households, the price at the pump is one of the most immediate and tangible indicators of inflation pressure.
Figure 5 US CPI - Energy (weight 6.4%)
What stands out in the recent data is that energy is no longer exerting a downward pull-on headline inflation. Instead, it has begun to add inflationary pressure back into the aggregate CPI, reversing the disinflationary impulse that characterized much of the previous period.
Shelter
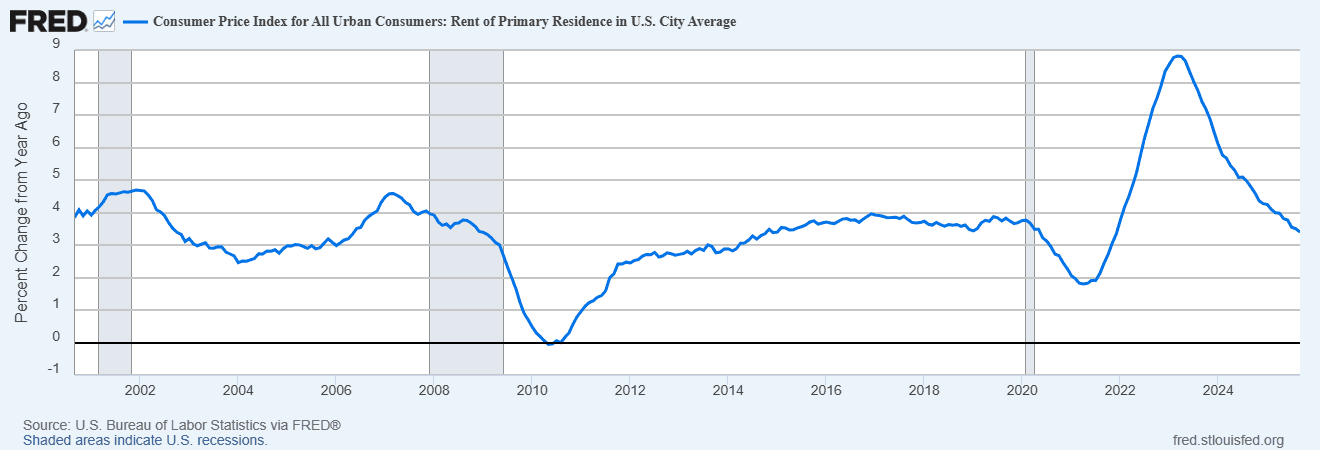
In the US CPI, the single largest component is Shelter, which represents 35.5% of the entire index. Within this category, Rent of Primary Residence accounts for 7.5% of CPI, broadly comparable to the weight assigned to rent in the EU Harmonised Index of Consumer Prices, as illustrated in Figure 6. After peaking in 2023, rent inflation has been drifting lower, but recent data suggest that the decline may be stabilizing, with the rate levelling off at roughly 3%.
Figure 6 US CPI - Rent of primary residence (weight 7.5%)
The dominant driver inside the Shelter category, however, is Owners’ Equivalent Rent of Residence (OER), which carries a substantial 26.2% weight in the overall CPI. OER inflation has eased to just under 4%, and this deceleration has been the principal force pulling US inflation lower over the past 18 months. Yet this category also raises several analytical questions, both in terms of its construction and its lagged dynamics within the broader inflation complex.
Figure 7 US CPI - Owners' Equivalent of Rent of Residence (weight (26.2%)

“OER” - an explanation
OER is not derived from direct market transactions, nor does it measure what homeowners actually pay, since homeowners do not pay rent. Instead, it is constructed from a specialized survey conducted by the Bureau of Labor Statistics (BLS) as part of the Consumer Expenditure Survey. The method estimates what a homeowner would pay to rent their own home, unfurnished and excluding utilities, thereby capturing the value of the housing services consumed rather than the price of the underlying asset.
The explanation from BLS is the following:
“The BLS uses data from owner-occupied units in the Consumer Expenditure Survey to derive expenditure weights. The expenditure weight in the CPI market basket for OER is based on the following question that the CE Survey asks of consumers who own their primary residence:
“If someone were to rent your home today, how much do you think it would rent for monthly, unfurnished and without utilities?”
From the responses to this question, the CPI program estimates the total shelter expenditure to all consumers living in each index area of the urban United States, which is then used to weight the OER index. Note that these responses are not used in estimating price change for the shelter categories, only the weight.”
At this stage, the BLS has established the weight of OER within the CPI basket, but it has not yet measured any price change for the component itself. To estimate how OER evolves over time, the BLS proceeds in a very specific way. It does not attempt to derive price movements from home values, mortgage rates or housing transactions. Instead, it relies on the observed dynamics of the rental market, using the following steps:
Owner-occupied units are not interviewed in the CPI Housing Survey; the Housing Survey sample contains only rental units. When a rental unit is on panel, CPI data collectors obtain the current rent, what additional services (for example, utilities) are included, and information on any changes to the unit or the rent that has occurred since its previous pricing six months ago.
Using the sample of rental units, the CPI program calculates a measure of price change for each CPI index area for the rent and OER indexes. The first step is standardizing the collected rents so that all rents are on a monthly basis. These standardized rents are called normalized rents. The normalized rents are then adjusted for any quality changes such as an additional bedroom or bathroom, changes to the type of heating and cooling equipment, and changes in extra charges such as an increase in total pet fees. The CPI program also adjusts rents for the effect of aging over time. Rents are collected for the same housing units every 6 months.
The BLS maintains a nationwide sample of roughly 50,000 rental units for the purpose of estimating rent dynamics. Because each unit is surveyed on a six-month rotation, this translates into approximately 8,000 new rent observations per month. For a country the size of the United States, this is not a large number. Spread across 50 states, it equates to roughly 160 observations per state per month, and even fewer once divided across metropolitan areas and housing types.
To move from these raw observations to an imputed housing cost for homeowners, the BLS applies a substantial series of statistical adjustments, imputations and normalizations. While these procedures are methodologically defensible within the CPI framework, they inevitably introduce layers of estimation between the observable rent data and the resulting OER index. This raises an important policy concern: when such a consequential share of the CPI - fully 26.2% - is derived through indirect and highly processed measures, it becomes increasingly difficult to anchor major economic decisions, particularly monetary policy, on such estimations.
US CPI - less shelter
A cleaner (and arguably more policy-relevant) gauge of US inflation is CPI less shelter, which represents 64.5% of the current CPI basket, as shown in Figure 8.
Figure 8 US CPI - CPI less shelter (weight 64.5%)
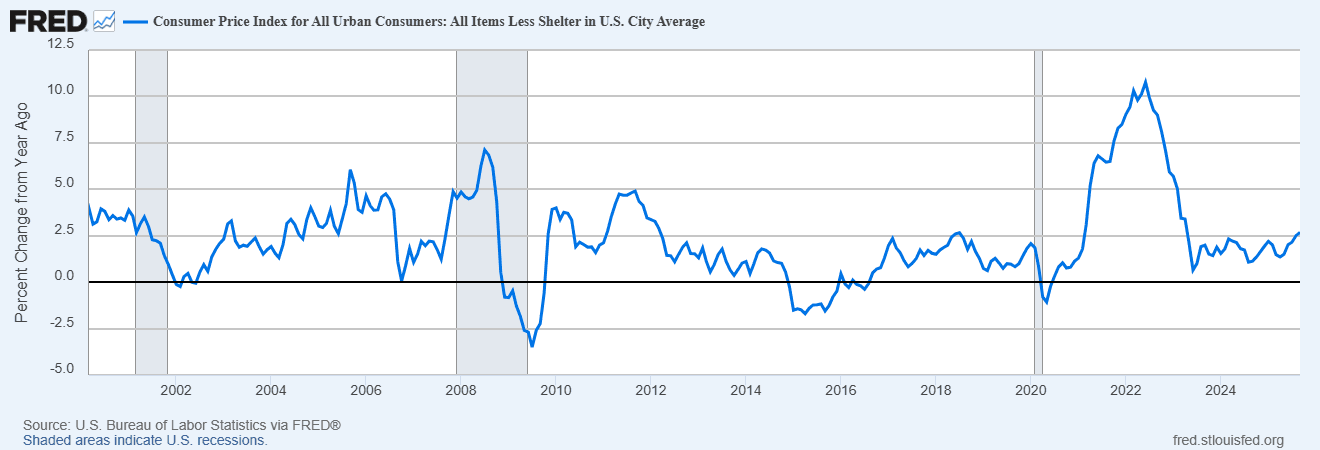
When viewed through this lens, the inflation landscape looks markedly different. Since late 2023, CPI less shelter has been trending upward and now stands above 2.5%. This trajectory implies that underlying inflationary pressure outside of housing has been firming rather than fading. One interpretation is that the Federal Reserve may have missed its optimal window to support the real economy by lowering interest rates toward the end of 2023, when disinflation appeared more broad-based.
The dilemma for the Fed is rooted in the legacy of aggressive quantitative easing (QE) implemented during and after the pandemic. The sheer volume of liquidity injected into the financial system has acted as a powerful driver of economic activity so that the liquidity, rather than monetary policy settings themselves, has been steering the bus. As a result, one could argue that the Fed’s policy mix since COVID-19 has disproportionately benefited Wall Street, while providing comparatively less direct support to Main Street.
If CPI less shelter continues to rise from its current level, the Federal Reserve could find itself in a difficult position. Rather than easing policy, it might eventually face pressure to raise interest rates again, underscoring the risk that inflation without the shelter component is becoming more persistent than previously assumed.
Conclusion
Headline CPI continues to suggest progress, but the underlying picture is far less convincing. With shelter disinflation driven almost entirely by OER (a statistically imputed measure rather than a true market price), the foundation of the current inflation narrative is fragile. CPI less shelter has been rising steadily, signalling that genuine, market-determined price pressures are firming rather than easing.
This leaves the Federal Reserve in a difficult position. Monetary policy cannot credibly be based on a component like OER, whose movements reflect survey-based imputation and long lags rather than real-time economic conditions. By focusing too heavily on this single, model-driven index, the Fed risks misreading the inflation landscape. If the market-based components continue to accelerate, the central bank may be forced to correct earlier misjudgements and maintain a tighter stance than currently anticipated.