
18/09/2026
The long road back to real yield — the beginning of a journey
Newsletter #95 - September 2026
Twelve months of rising yields
Let us begin with what has actually happened the last year. Figures 1 and 2 show the ten-year Treasury and the ten-year Bund over the past twelve months, based on daily observations. Both bottomed within a week of each other in the second half of October 2025 and both closed this week at their highest level of the year.
Figure 1 — United States: 10-year Treasury yield, daily, last twelve months (source: FRED; Quantrom).
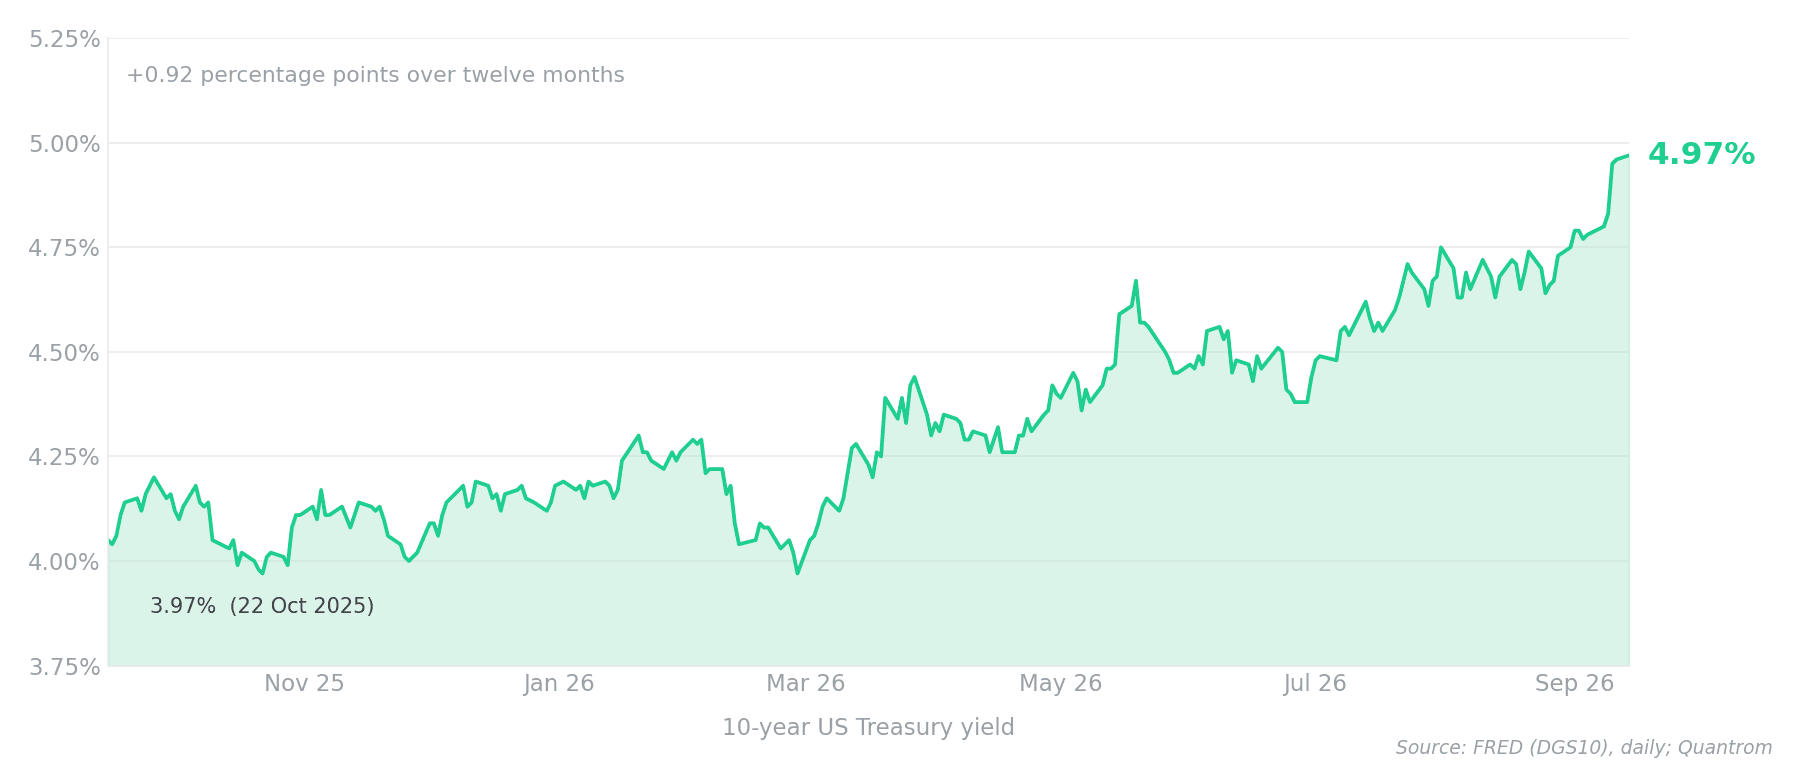
Figure 2 — Germany: 10-year Bund yield, daily, last twelve months (source: Deutsche Bundesbank; Quantrom).
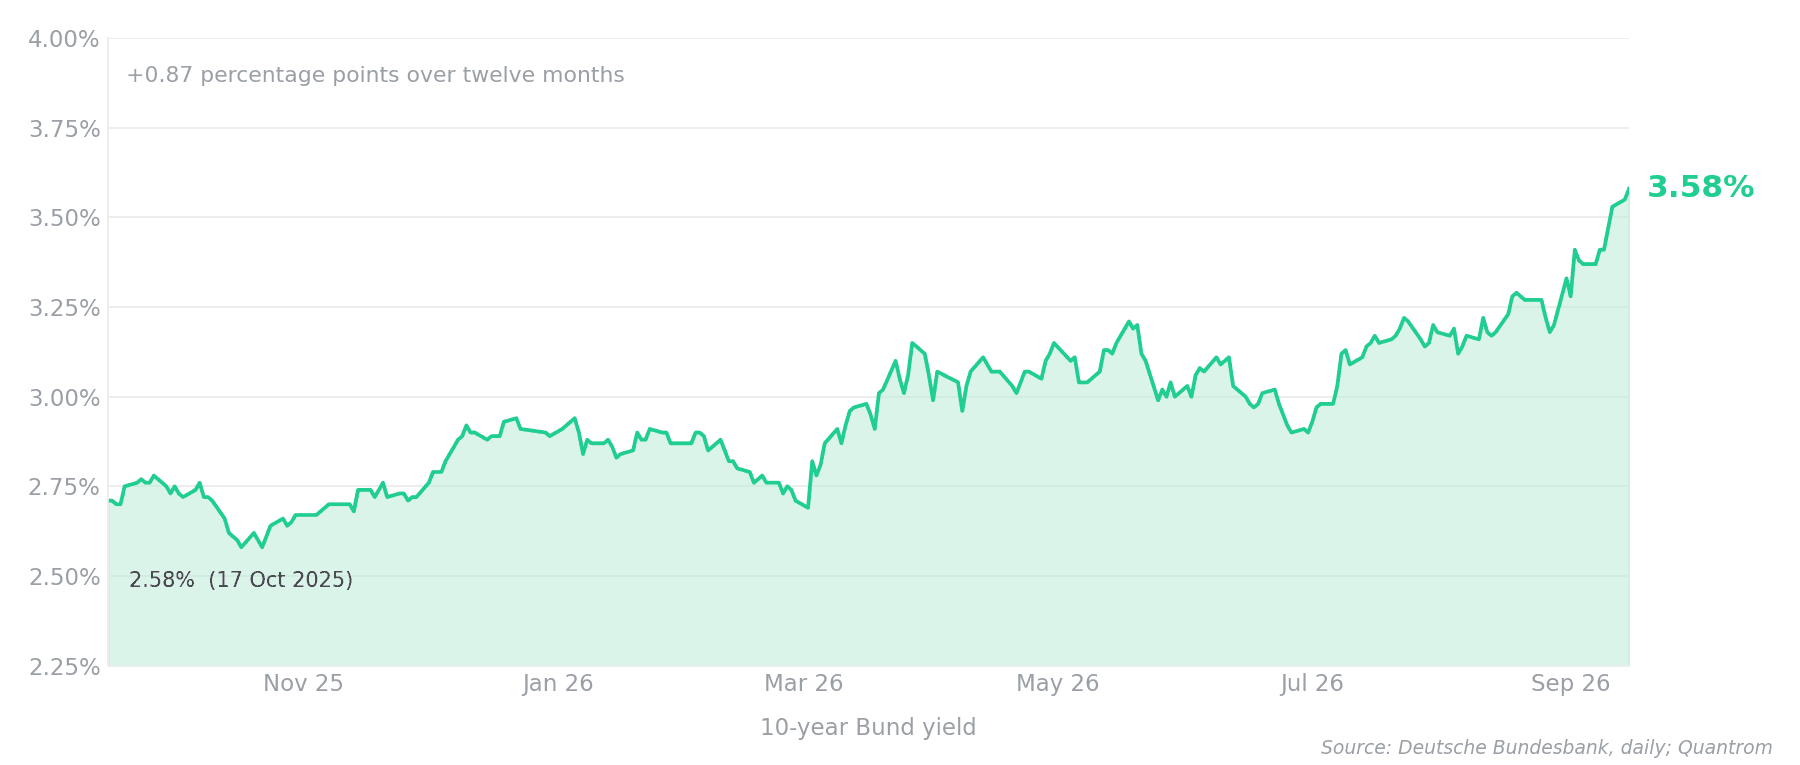
The Treasury has risen by 0.92 percentage points over the year, from a low of 3.97% to 4.97%; the Bund by 1 percentage point, from 2.58% to 3.58%. The two markets have moved almost in lockstep, and the spread between them has held close to 1.4 points throughout. On the nominal numbers alone, this looks like the normalisation that investors have been waiting for.
It is not, or at least not yet.
German inflation on the harmonised measure was 2.9% in August against 2.4% in June, and the euro area rate reached 3.3% inAugust. Nominal yields rose over the summer, as the price level did. The real yield on the Bund is therefore about 0.7% today against roughly 0.6% three months ago — a difference small enough to call it practically unchanged.
A note on the data before we proceed.
Figures 1 and 2 use daily observations to the middle of September 2026. All other figures in this Newsletter are built on monthly data, which for most of the series involved ends in July 2026.
Where the road starts
An investor is paid in nominal terms and lives in real ones. The distinction determines whether a portfolio has been compensated for parting with money or merely reimbursed in a weaker currency. Figure 3 sets US consumer price inflation against the ten-year Treasury yield, and Figure 4 does the same for Germany. The band between the two lines is the realised real yield (mint where the bond pays more than inflation, grey where it does not).
Figure 3 — United States: consumer price inflation and the 10-year Treasury yield, monthly, 1962–2026 (source: FRED; Quantrom).
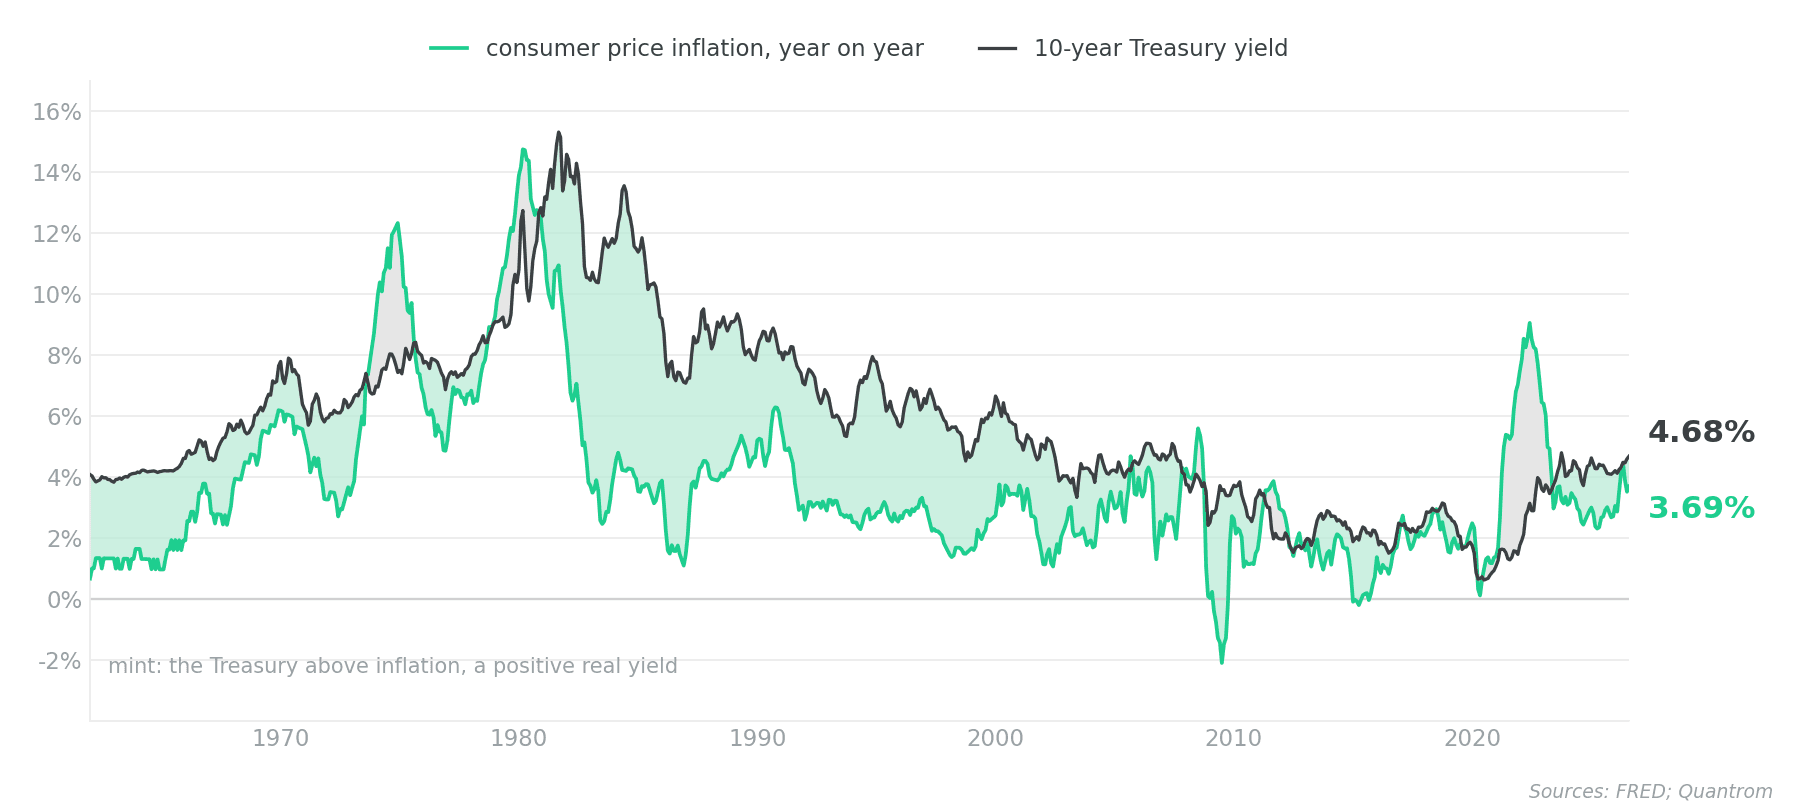
Figure 4 — Germany: consumer price inflation and the 10-year Bund yield, monthly, 1956–2026 (source: OECD via FRED, Eurostat; Quantrom).
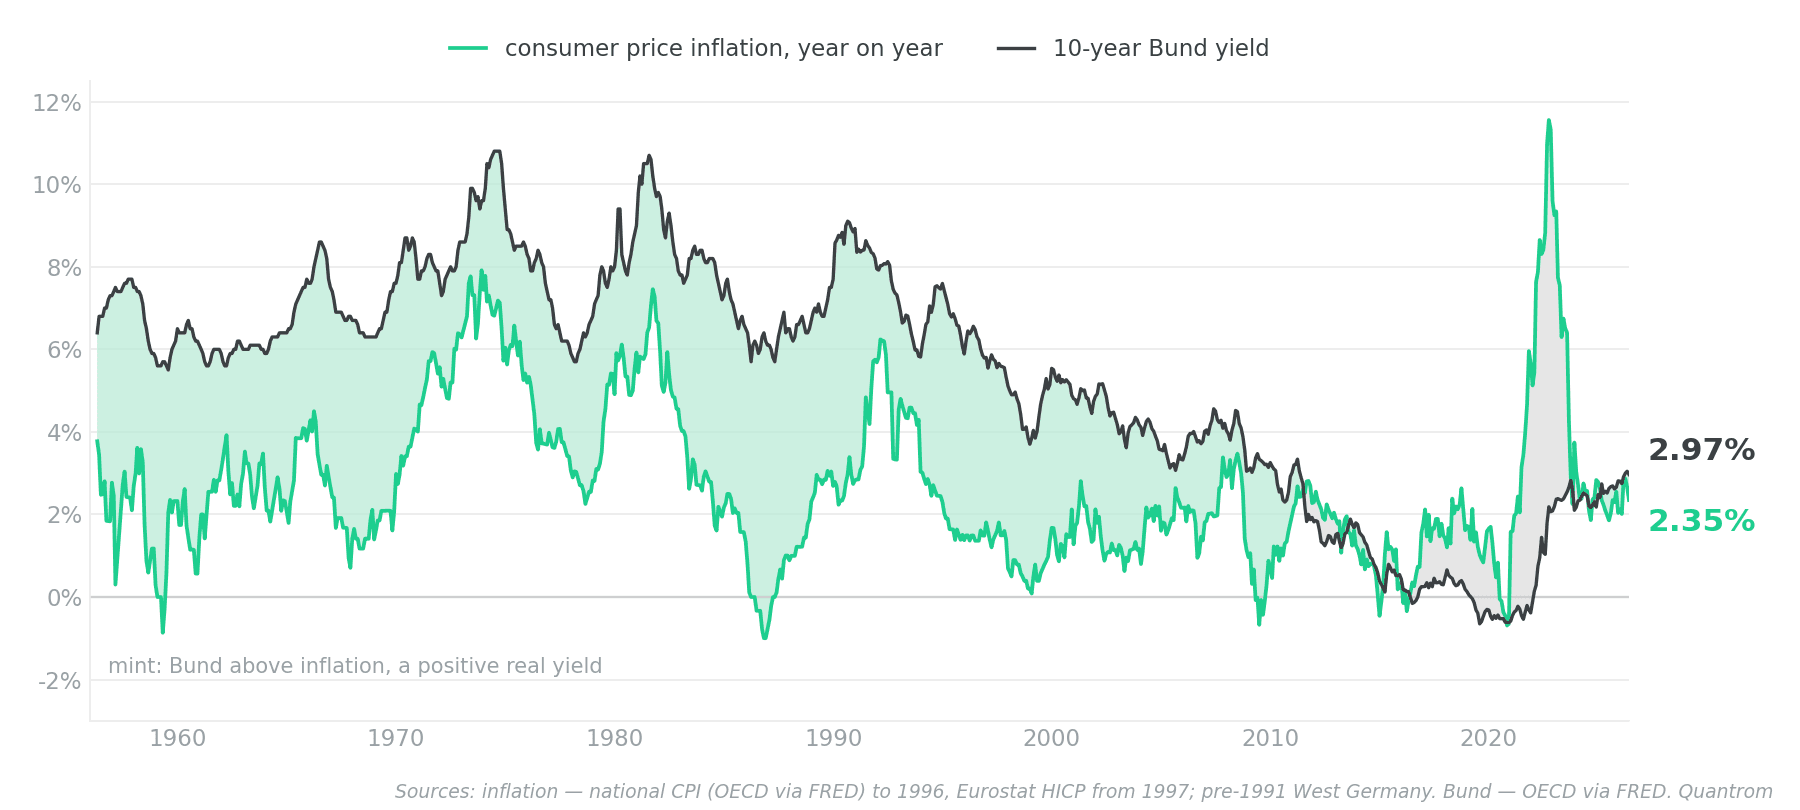
The long record is unambiguous. Across 775 months since 1962, the Treasury has paid a real 1.99% on average and has fallen short of inflation in 16% of them. The Bund's record is stronger still: a mean real yield of 2.66% since 1956 and — this is the striking figure — not a single month below inflation before 2000. Neither of the 1970s oil shocks breached it. The Bundesbank's reputation was clearly not rhetorical; it is legible in the data.
Set against that history, the decade now ending is the anomaly. It is also the decade in which most of the bonds currently sitting in European portfolios were bought, which is why the starting point of the journey matters more than it might appear.
The distribution, not the average
A six-decade average conceals more than it reveals, because the real yield has not fluctuated around a stable centre. It has moved between regimes. Figures 5 and 6 therefore show the distribution of the monthly real yield within each era rather than its path, drawn on a common scale so that the two markets may be compared directly.
Figure 5 — United States: distribution of the real 10-year yield by era, 1962–2026 (source: FRED; Quantrom).
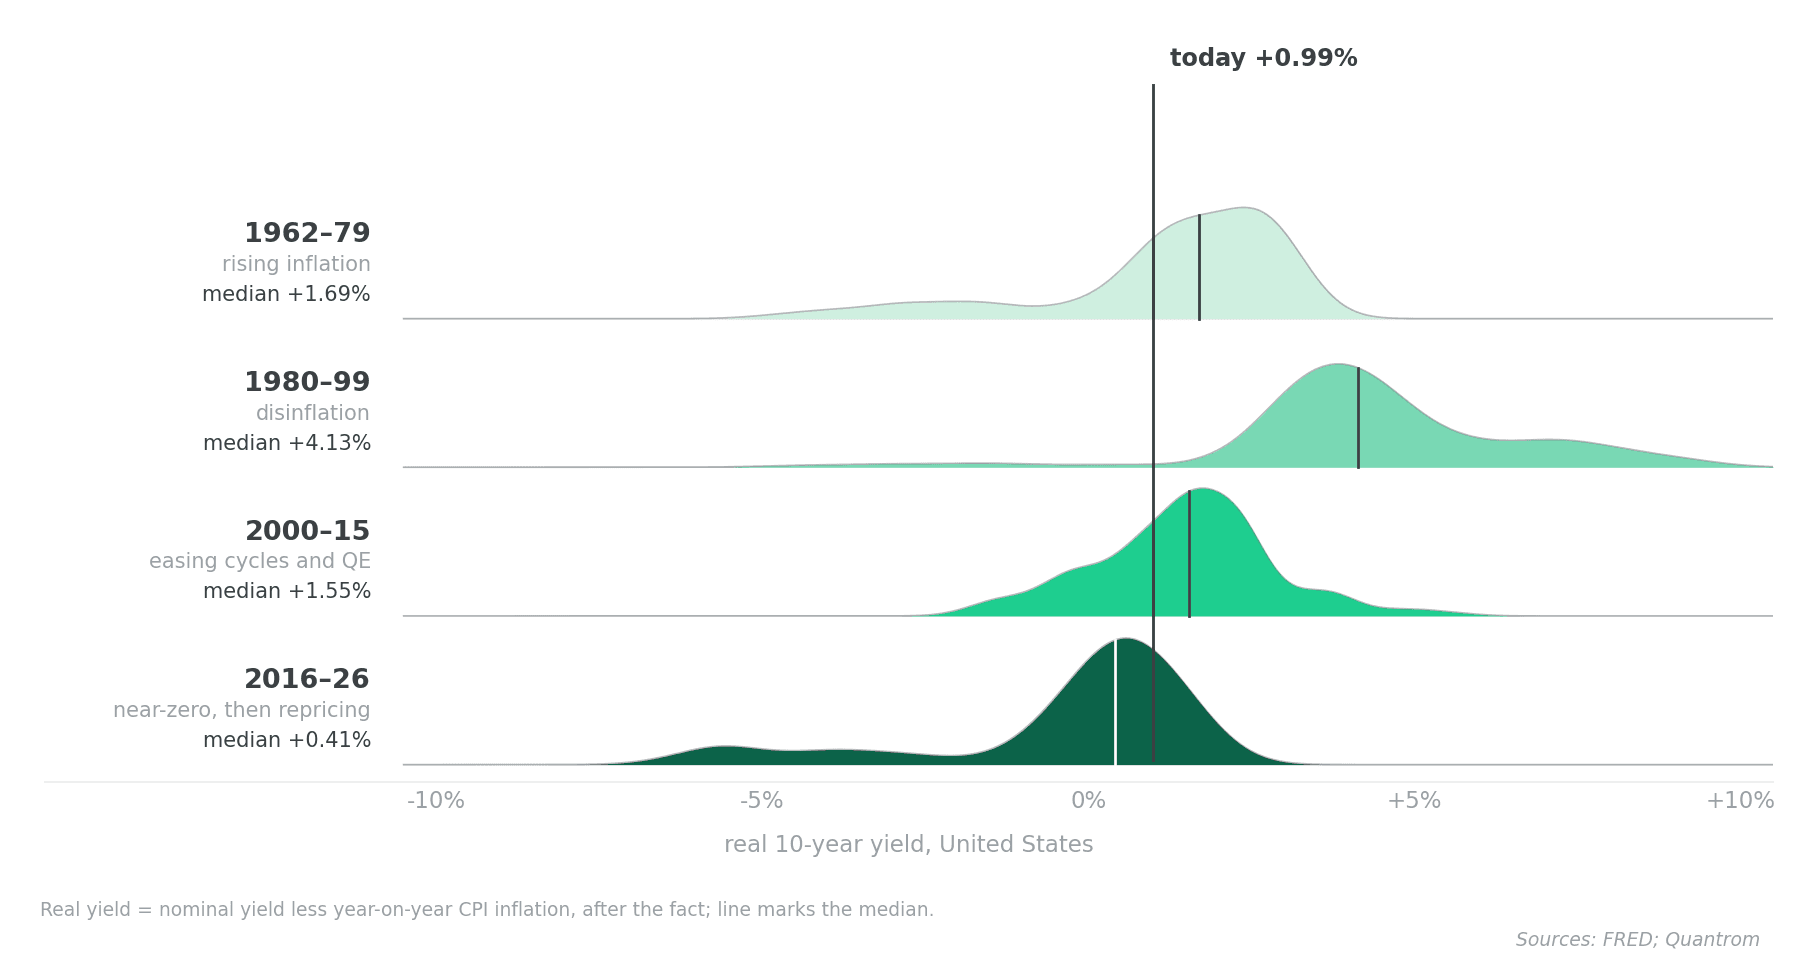
Figure 6 — Germany: distribution of the real 10-year yield by era, 1962–2026 (source: OECD via FRED, Eurostat; Quantrom).
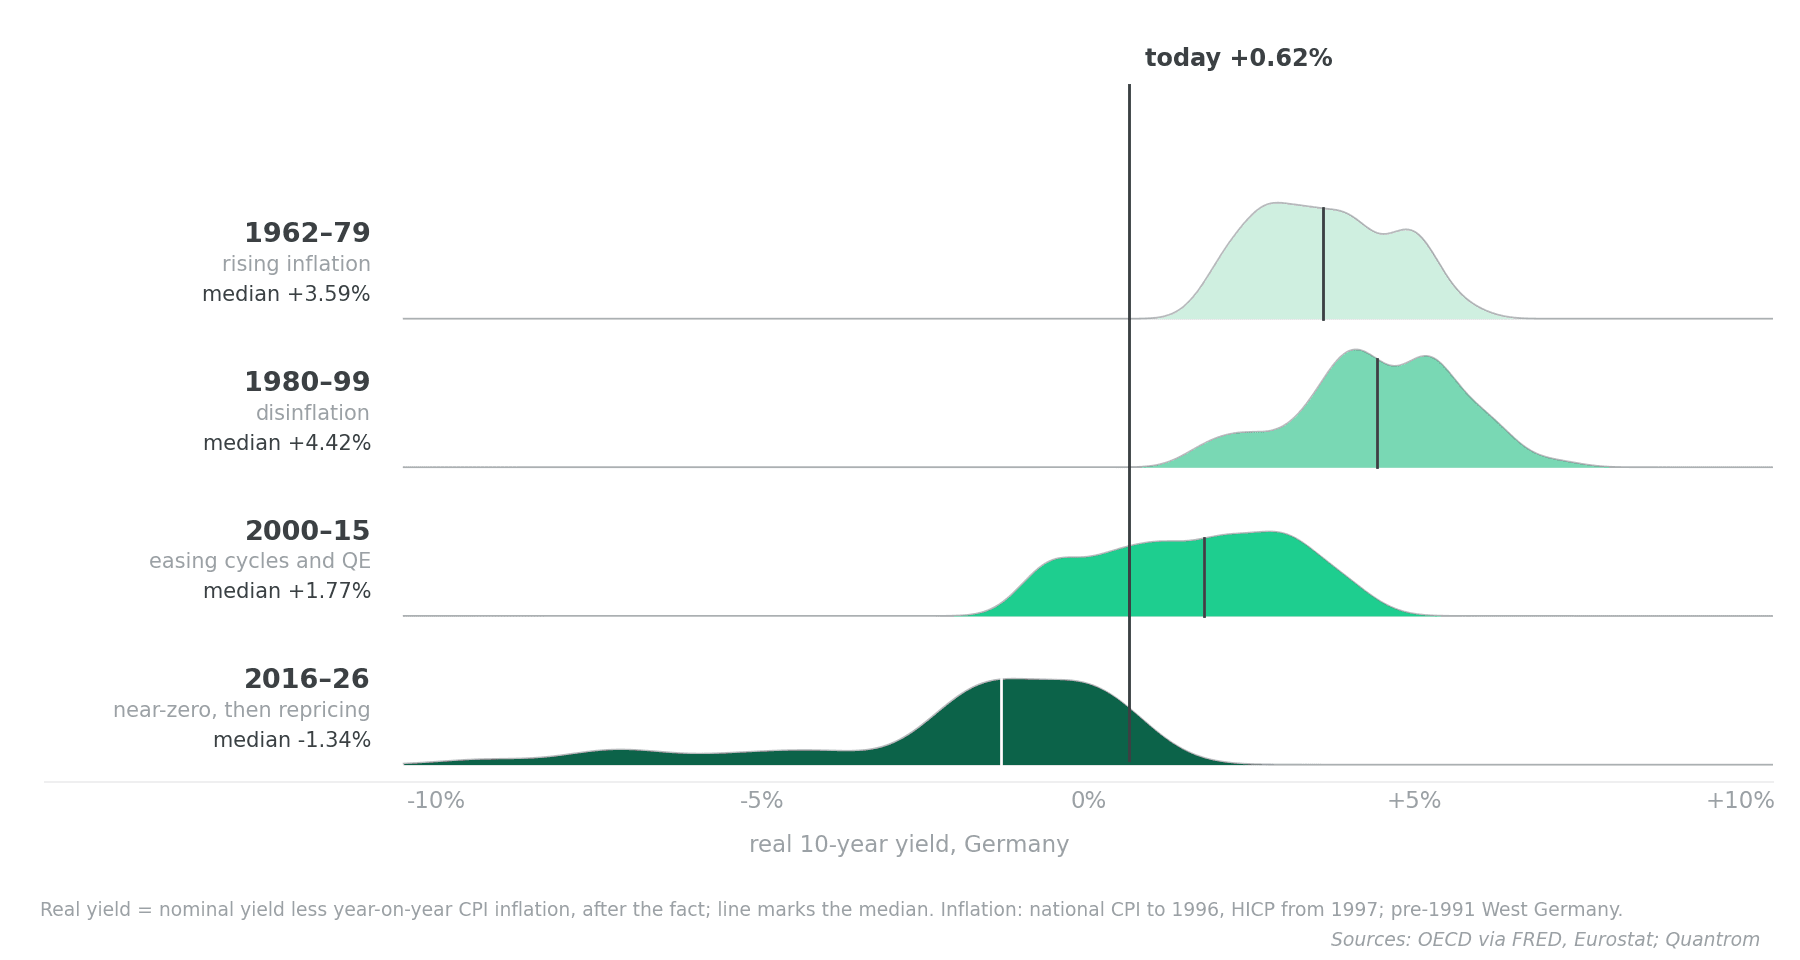
The German medians are the ones to hold in mind: 3.59% in the inflationary years to 1979; 4.42% through the disinflation of 1980–99; 1.77% across the easing cycles and quantitative easing of 2000–15; minus 1.34% from 2016. The American series tells the same story in a narrower range: 1.69%, 4.13%, 1.55% and 0.41% respectively.
In Germany, the most recent distribution is the only one in either figure whose central mass sits to the left of zero: for 79% of the months since 2016 the Bund paid less than inflation.
Discard the two extremes — the disinflation of the 1980s and the financial repression of the 2010s — and the remaining eras bracket a real yield of roughly 1.5% to 3.5%. That is our working definition of normal, and it is drawn from the instruments’ own history rather than from a model. At about 0.7% today, the Bund is between one and three percentage points short of it. The market has priced in the end of negative nominal rates. It has not yet priced in the restoration of a normal real return.
The coupon did not cover the repricing
The actual repression cost is a matter of record rather than conjecture. Figures 7 and 8 track two Bloomberg total-return benchmarks alongside our own return measure, all three rebased to 100 in March 2017 and carried to July 2026, the last month for which the EU harmonised index has been published. Figure 7 is nominal; Figure 8 is deflated by that index.
Figure 7 — Nominal total return, March 2017 = 100 (source: Quantrom; Bloomberg).
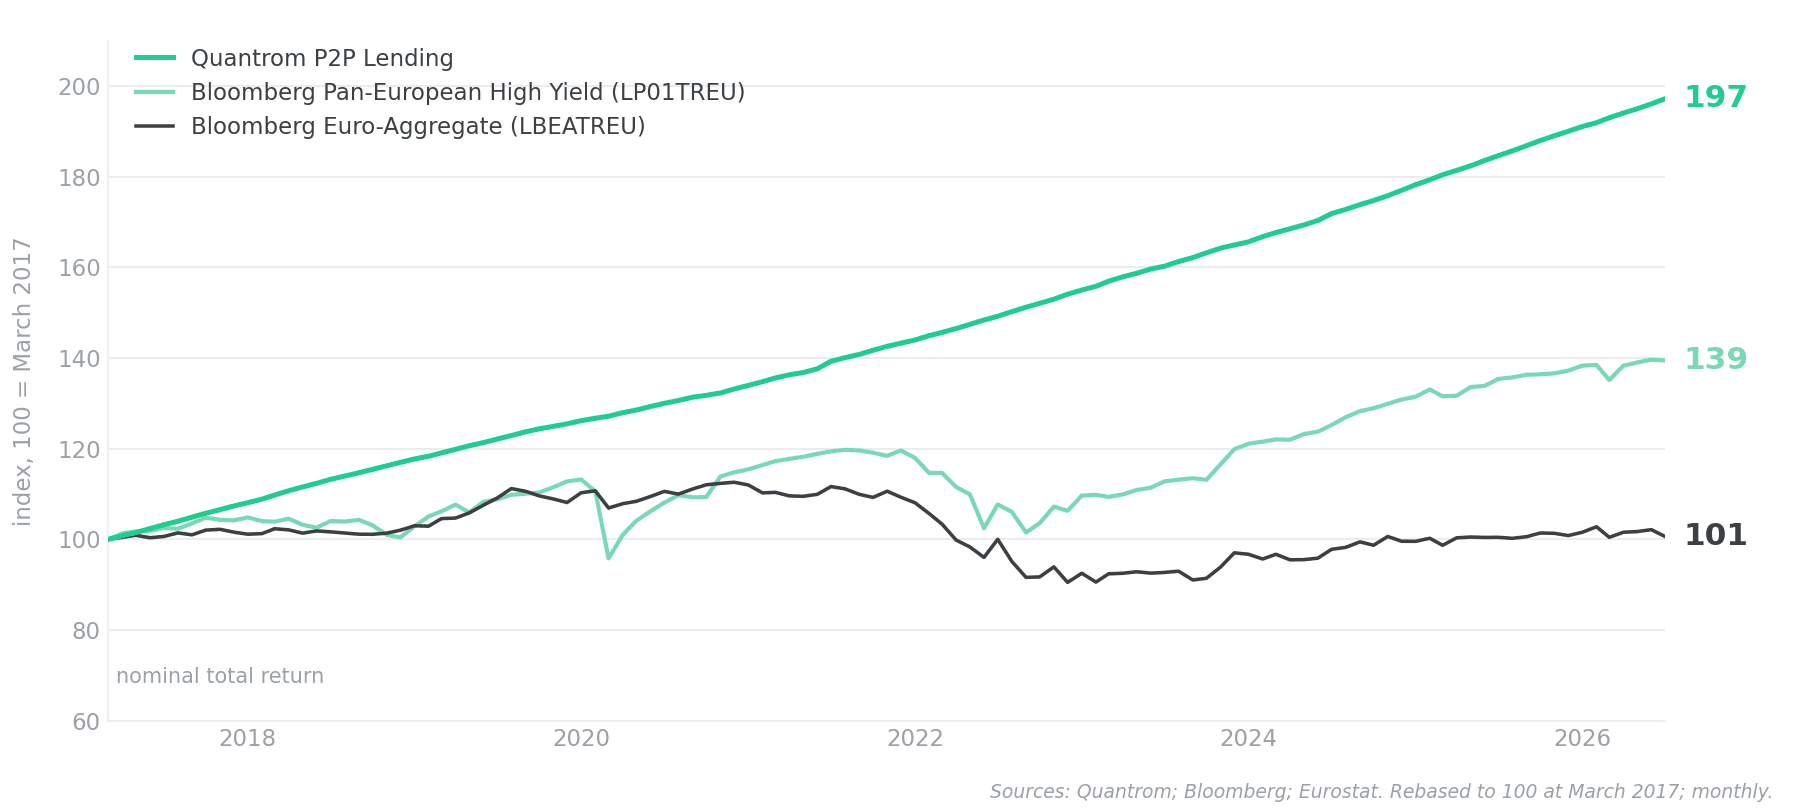
Figure 8 — Real total return, deflated by the EU HICP, March 2017 = 100 (source: Quantrom; Bloomberg; Eurostat).
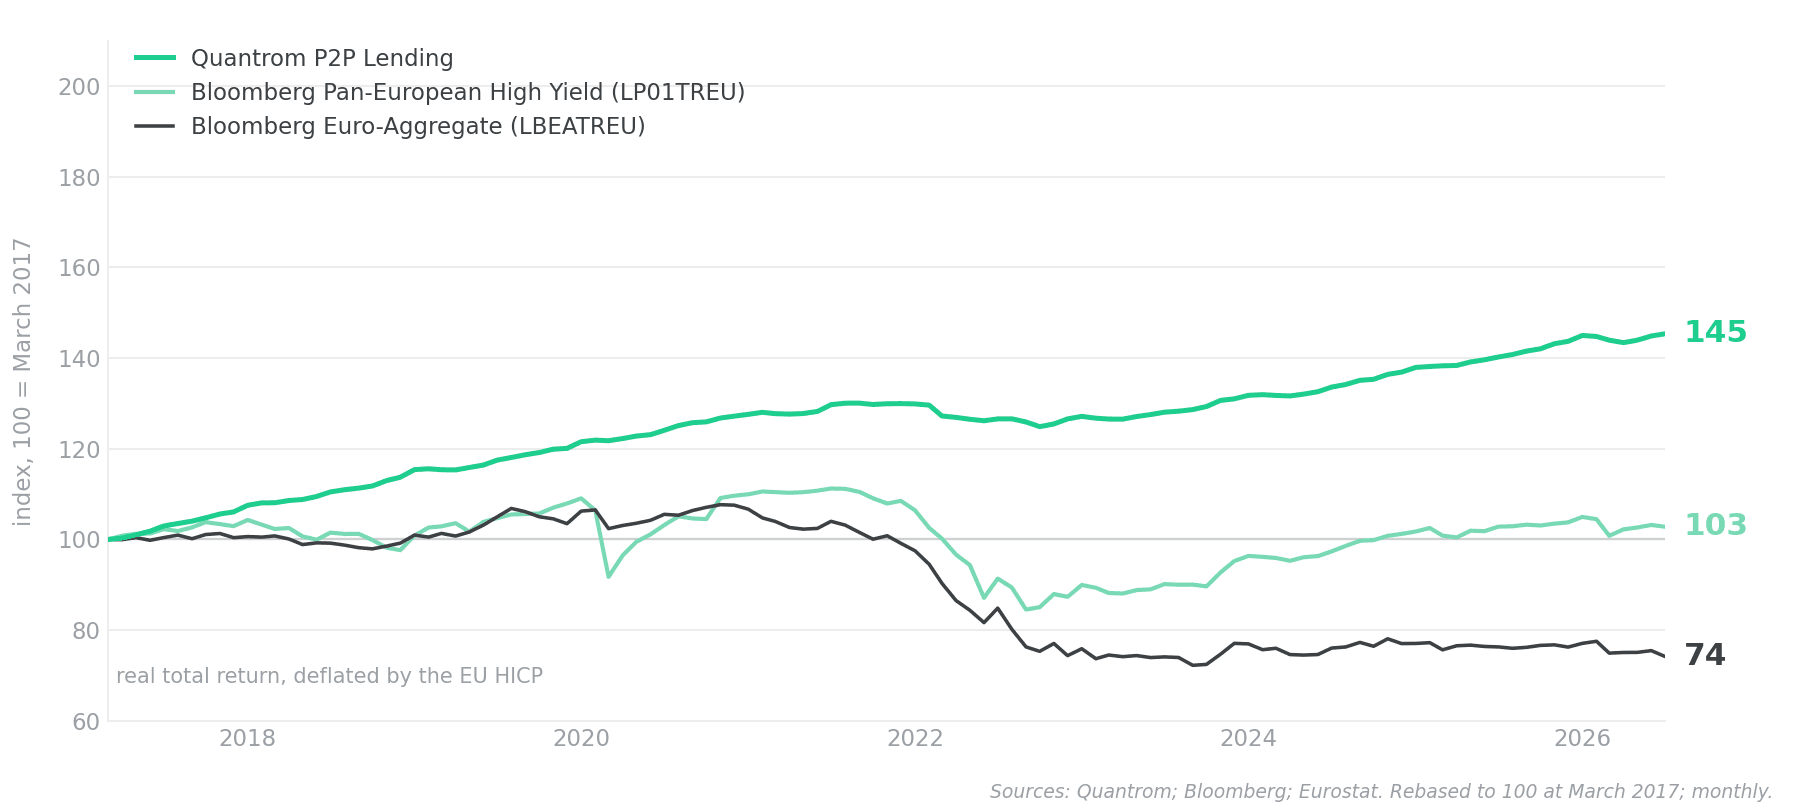
The Bloomberg Euro-Aggregate index — the broad euro investment-grade benchmark — stands at 100.7 after nine years and four months. An investor who bought in March 2017 has, in nominal terms, nothing to show for the period beyond the return of the original capital: 0.07% a year. The coupons were collected and then handed back through the mark-to-market revaluation as yields rose from 2022. Deflated, the index falls to 74.2, an annualised minus 3.15%, and it spent 66 of its 113 months below its starting value.
The instructive case, however, is the high-yield sector. If any coupon should have been large enough to absorb a repricing, it is the one paid by sub-investment-grade borrowers. The Bloomberg Pan-European High Yield index returned 39.5% in total, an annualised 3.63% — a respectable nominal figure. In real terms, it returned 2.8% in total, or 0.30% a year. Nine years of credit risk, including a 15.4% nominal drawdown in March 2020 and a 24.0% real drawdown by September 2022, delivered thirty basis points a year above inflation. The coupon did not cover the repricing at investment grade, and it did not cover it in high yield either.
Cash received versus cash marked
Our own return measure appears in Figures 7 and 8 as a contrast in construction as much as in outcome, and the distinction deserves to be stated plainly.
Quantrom P2P Lending is not marked to market. Our measured return records cash actually received: interest is recognised when it is paid, and nothing is accrued in anticipation of it. There is no daily revaluation of the loan book, and therefore no equivalent of the mark-to-market movement that dominates the two bond indices.
Credit losses are treated as a bank treats its loan book rather than as a trader treats a position. A loss is taken when it occurs, and where deterioration is evident but not yet crystallised, a provision is raised against the book. The charge reaches the noted return through the same route as the interest does — as a realised amount rather than as a valuation adjustment.
This cuts in both directions and the reader should weigh both. A traded bond index prices a deterioration the moment the market perceives it, whereas a book recorded on cash and provisions recognises it as it emerges, which is later. Smoothness of the line is a property of the measurement and not, by itself, evidence of lower risk. But it also means that the 7.54% annualised nominal and 4.09% real returns in the figures are composed of money that arrived rather than of a valuation.
Taken together, that is the difference the two figures illustrate. The interest we received was large enough to compensate for inflation across the period. The coupons on euro government and corporate bonds were not.
The beginning of a journey
A Bund at 3.58% is a different proposition from a Bund at minus 0.65%, and it would be churlish to pretend otherwise. The direction of travel is correct and the first stretch of road has been covered. Our assessment is simply that it is the first stretch. Measured against the only benchmark that matters to a saver, a real yield near 0.7% is the upper end of an abnormal decade rather than the lower end of a normal one.
The past year illustrates the point rather neatly. Nominal yields rose by close to a percentage point in both markets, which on the face of it is a substantial move, and the investor is no better compensated at the end of it than at the beginning, because inflation rose in step. Rising yields and rising real returns are not the same thing, and only the second is of any use to the holder of a bond.
Nor is the inflation side of the calculation settled. Euro area inflation has risen from 1.7% in January of this year to 3.3% in August, above the European Central Bank's target for five consecutive months. We do not offer this as a forecast; the direction from here is genuinely uncertain and the honest position is to say so. But a real yield below 1% offers remarkably little protection against being wrong.
The missing compensation will be recovered in one of two ways: inflation falls further than the market currently expects, or nominal yields rise further still. Only one of those is comfortable for a bondholder, and it is not the one presently priced. The question we would put to investors, as they review portfolios built during the era of repression, is therefore this: Is the real rate of interest on offer today sufficient compensation for lending to a government for ten years — or is this merely the beginning of the return journey?
